


Childhood Obesity: A lifelong threat to health
Visit profiles to view data profiles on chronic and disabling conditions and on young retirees and older workers.
Almost 14 million children — 24 percent of the U.S. population ages 2 to 17 — are obese. An additional 8.6 million children are at risk for obesity. Differences in health between obese and non-obese children are not great. However, obese children often remain obese in adulthood. While obesity itself is not a chronic condition, it is a risk factor for four of the 10 leading causes of death in the U.S. — coronary heart disease, type II diabetes, stroke, and cancer.(1) Obesity and physical inactivity account for more than 300,000 premature deaths each year in the U.S.
Body Mass Index (BMI) expresses the relationship of weight-to-height and is used to screen and monitor the risk of obesity. The Centers for Disease Control and Prevention has developed BMI charts adjusted for age and gender for children ages 2 to 20. Children with BMI values at or above the 95th percentile are categorized as “obese” or “overweight.” Children between the 85th and 95th percentiles are considered “at risk for obesity or overweight.” This Profile examines the group of children ages 2 to 17 with BMI values at or above the 95th percentile and those with BMI values between the 85th and 95th percentiles, and refers to them as “obese” and “at risk for obesity.”
Obesity is associated with physical inactivity
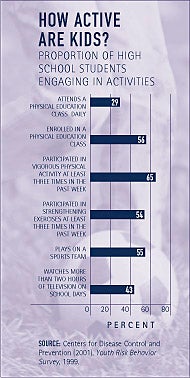
Sedentary lifestyles and physical inactivity may be risk factors for obesity in youth. Two factors that have contributed to the decline in the physical activity of many children are a greater reliance on television and computers for entertainment and decreased participation in physical education programs in schools. Over one-quarter–26 percent–of children ages 8 to 16 watch four or more hours of television per day. And 43 percent of high school students watch more than two hours of television on school days. The proportion of high school students attending a physical education class daily decreased from 46 percent in 1991 to just 29 percent in 1999.(2)
Childhood obesity is increasing at alarming rates, particularly among minorities
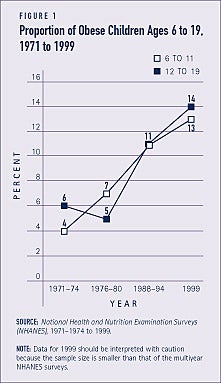
Over the past several decades, there has been a sharp increase in the proportion of children who are obese (see Figure 1). Obesity has increased among all children, regardless of age, sex, and race. The increase in obesity among black and Hispanic children is particularly great. From 1986 to 1998, obesity among black and Hispanic children increased by more than 120 percent, compared to about 50 percent among white children.(3)
One-third of black and low-income children are obese
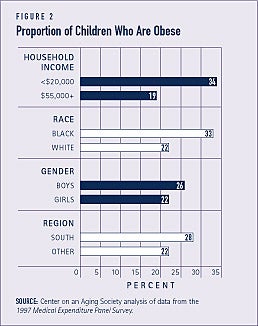
- Some 34 percent of children from lower income households are obese, compared to 19 percent of children from higher income households.
- One-third of black children and over one-fifth of white children are obese.
- A larger proportion of boys than girls are obese.
- Some 28 percent of children from the South are obese, compared to 22 percent of children from other regions of the country (see Figure 2).
Older children are more likely to be at risk for obesity
Seventeen percent of children ages 6 to 17 are at risk for obesity, compared to 10 percent of children under age 6. Preventing obesity in childhood may eliminate many of the adverse health and economic consequences associated with obesity later in life. In addition to decreasing quality of life, obesity can cause premature death.
Obese children are generally healthy
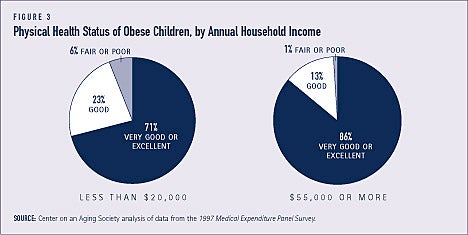
Most obese children are reported to be in very good or excellent physical health, although those from higher income households are in somewhat better health. Nearly three-quarters — 71 percent — of obese children from households with an annual income of less than $20,000 and 86 percent of obese children from households with an annual income of $55,000 or more are reported to be in very good or excellent health. A small proportion — 6 percent — of obese children from low-income households are in fair or poor health. They are, however, six times more likely to be unhealthy than obese children from high-income households (see Figure 3).
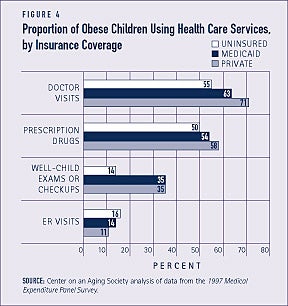
Health care use by obese children differs by income and insurance coverage
Use of health care services is similar among obese and non-obese children. For example, 67 percent of obese and 65 percent of non-obese children visited the doctor at least once in the past year. Among obese children from low-income households, about half — 56 percent — visited the doctor at least once in the past year, compared to over three-quarters — 76 percent — of those from high-income households. This may reflect the fact that low-income populations tend to have reduced access to medical care. A slightly larger proportion of obese children from low-income households visit the emergency room, compared to their high-income counterparts.
With the exception of visits to the emergency room, obese children who are uninsured use fewer health care services than those with health insurance. For example, uninsured obese children are less than half as likely to receive well-child or checkup examinations as obese children covered by Medicaid or private insurance (see Figure 4).
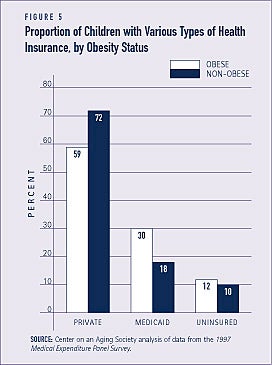
Obese children rely more on Medicaid and less on private insurance
Health care coverage under the Medicaid program is important to many children who otherwise would have no health insurance. The publicly financed Medicaid program provides health insurance for over 4 million obese children. Nearly one-third — 30 percent — of obese children are covered under Medicaid, compared to just 18 percent of non-obese children. A smaller proportion of obese children than non-obese children are covered by private insurance — 59 and 72 percent, respectively (see Figure 5).
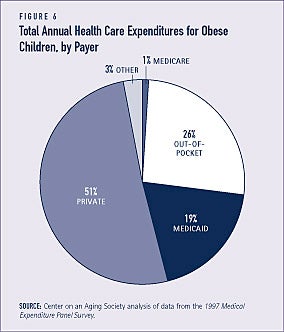
Families of obese children pay a substantial amount out-of-pocket for health care
About 70 percent of the total annual health care expenditures for obese children are financed by Medicaid and private insurance. However, over one-quarter — 26 percent — of the health care costs for obese children are paid out-of-pocket by their families (see Figure 6). Some of these payments may be for services not generally covered by health insurance, such as weight management programs or supportive services. Low-income families are more likely to have restricted access to these types of services.
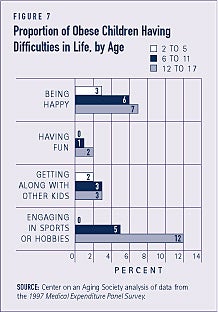
Obese children seem as well-adjusted as other children
Overall, obese and non-obese children are both reported to be socially well-adjusted. For the most part, neither group of children has difficulty being happy, having fun, or getting along with other children. For example, only 2 percent of obese children and 1 percent of non-obese children report that they do not have fun.
Compared to younger obese children, older obese children are generally more likely to have negative feelings about themselves and their lives. Still, the proportions of obese children with negative feelings are small. The biggest difference among younger and older obese children is reflected in the proportions having substantial difficulty playing sports. Obese children ages 12 to 17 are twice as likely to be unhappy as obese children under age six (see Figure 7). Negative feelings developed among older obese children often have longer-term consequences for their emotional and mental well-being as they become adults.(4)
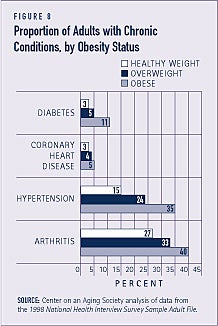
Obese children are likely to remain obese as adults and face increased health care risks
Because physical activity and dietary habits developed early in life are often carried into adulthood, obesity during childhood or adolescence often persists.(5) The probability that an obese child will become an obese adult increases with age. Obesity in adulthood is a risk factor for various chronic conditions such as diabetes and hypertension (see Figure 8). Obese children younger than age three are generally at low risk for obesity in adulthood. But more than one-half of obese children over age 6 become obese adults. Obese children ages 12 to 17 are even more likely to be obese in adulthood. Between 70 and 80 percent of obese adolescents remain obese in adulthood.(6) This may reflect the likelihood that parents have more control over the dietary and physical activity patterns of younger children. Older children, however, are likely developing independent behaviors as they approach adulthood.(7)
Obesity and related illnesses kill 300,000 Americans annually
Obesity and overweight may soon cause as much preventable disease and death as cigarette smoking — some 430,000 people die annually from tobacco-related conditions. About 300,000 people die annually — 1,200 daily — from illnesses related to obesity or overweight. According to the National Institutes of Health, weight loss of 15 pounds could reduce the risk of diabetes by 58 percent in individuals who are close to developing the disease.
Obesity is costly
The total cost of obesity was estimated to be $117 billion in 2000. Direct health care costs accounted for over half — $61 billion — of the total cost.(8) Obese individuals are at risk for developing chronic conditions that often require acute and long-term care. They may also be limited in daily activities, including paid work. Increased health care use and lost productivity from missed work days due to obesity contribute to the substantial costs of obesity. Proper treatment and management of obesity can reduce these costs, however. For example, cost savings can be achieved with regular physical activity. One estimate suggests that increasing physical activity among more than 88 million inactive Americans over age 15 could reduce annual health care costs by as much as $77 billion in 2000 dollars.(9)
1. Wolf, A.M. (2001). “The Economic Impact of Obesity: Building Bridges with Managed Care.” Strategies for Weight Management: A Postgraduate Medicine Special Report. Minneapolis, MN: The McGraw-Hill Companies, Inc.
2. Andersen, R.E., C.L. Crespo, S.J. Bartlett, L.J. Checkin, and M. Pratt. (1998). “Relationship of Physical Activity and Television Watching with Body Weight and Levels of Fatness Among Children: Results from the Third National Health and Nutrition Examination Survey.” Journal of the American Medical Association; 279(12): 938_942.
3. Strauss, R. and H. Pollack. (2001). “Epidemic Increase in Childhood Overweight, 1986-1998.” Journal of the American Medical Association; 286(22): 2845-2848.
4. Dietz, W.H. (1998). “Health Consequences of Obesity in Youth: Childhood Predictors of Adult Disease.” Pediatrics; 101(3): 518_525.
5. Nader, P.R., E.J. Stone, L.A. Lytle, C.L. Perry, S.K. Osganian, S. Kelder, L.S. Webber, J.P. Elder, D. Montgomery, H.A. Feldman, M. Wu, C. Johnson, G.S. Parcel, and R.V. Luepker. (1999). “Three-Year Maintenance of Improved Diet and Physical Activity.” Archives of Pediatric Adolescence Medicine; 153: 695_704.
6. Whitaker, R.C., J.A. Wright, M.S. Pepe, K.D. Seidel, and W.H. Dietz. (1997). “Predicting Obesity in Young Adulthood from Childhood and Parental Obesity.”
The New England Journal of Medicine; 337(13): 869_873.
7. Barlow, S.E., and W.H. Dietz. (1998). “Obesity Evaluation and Treatment: Expert Committee Recommendations.” Pediatrics; 102(3): e29.
8. Personal communication to the Surgeon General by A. Wolf, November 26, 2001.
9. Pratt, M., C. Macera, and G. Wang. (2000). “Higher Direct Medical Costs Associated with Physical Inactivity.” The Physician and Sportsmedicine; 28(10): 63_70.
ABOUT THE DATA
Unless otherwise noted, the data presented in this Profile are from two national surveys of the United States civilian non-institutionalized population. The National Health Interview Survey (NHIS), which is conducted annually by the National Center for Health Statistics, is the principal source of information on the health of the U.S. population. The 1997 Medical Expenditure Panel Survey (MEPS) is cosponsored by the Agency for Healthcare Research and Quality and the National Center for Health Statistics. It provides national estimates of health care use, expenditures, sources of payment, and insurance coverage.
ABOUT THE PROFILES
This is the second set of Data Profiles in the series, Challenges for the 21st Century: Chronic and Disabling Conditions. The series is supported by a grant from the Robert Wood Johnson Foundation. This Profile was written by Kristen Kiefer with assistance from Lee Shirey and Laura Summer. It is the second in the new series. The first Profile was:
1. Screening for Chronic Conditions: Underused services
The Center on an Aging Society is a Washington-based nonpartisan policy group located at Georgetown University’s Institute for Health Care Research and Policy. The Center studies the impact of demographic changes on public and private institutions and on the economic and health security of families and people of all ages.