Visual Impairments
Visit profiles to view data profiles on chronic and disabling conditions and on young retirees and older workers.

Impaired vision can range from poor vision to blindness. People whose vision cannot be corrected by ordinary glasses, contact lenses, medication, or surgery have visual impairments. People with visual impairments have difficulty with routine tasks, such as reading a newspaper, even with glasses or contact lenses. Visual impairments are associated with four main causes: cataracts, macular degeneration, glaucoma, and diabetic retinopathy. A cataract is a clouding of the eye lens that reduces visual sharpness. Macular degeneration is the deterioration of the central area of the retina responsible for detail vision. Glaucoma refers to a diverse group of eye diseases resulting in irreversible damage to the optic nerve caused by increased pressure in the eye. Diabetic retinopathy occurs in people with advanced or long-term diabetes, and is caused by leaking blood vessels that damage the entire retina.(4) This Profile describes the population that has difficulty seeing even with glasses or contacts, including people who are blind.
A growing concern as the population ages
Almost 20 million Americans — 8 percent of the U.S. population — have visual impairments. Visual impairments, including blindness, are one of the leading causes of loss of independence among people age 65 and older.(1) Costs related to visual impairments total about $40 billion a year in the U.S. Medical costs account for almost 60 percent — $22 billion — of the total cost.(2) Although many causes of visual impairments are preventable, the number of people with such impairments is expected to double within the next three decades.(3) Visual impairments range from poor vision to blindness, and cannot be completely corrected by glasses, contact lenses, medication, or surgery. People with visual impairments have difficulty performing routine tasks, such as reading a newspaper. Compared to those who do not have difficulty seeing, people who have difficulty seeing are more limited in their activities, including paid work and social engagements. Furthermore, people with visual impairments generally use more health care services and experience higher out-of-pocket health care costs than those who do not have visual impairments.
Costs related to visual impairments are largely paid out of pocket
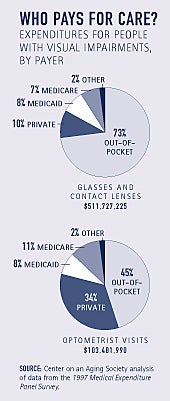
Health care costs for people who have difficulty seeing include those related to glasses and contact lenses and visits to optometrists. In 1997, the total cost of glasses and contact lenses for people with visual impairments was over $511 million. Almost three-quarters — 73 percent — was paid out-of-pocket. Out-of-pocket expenditures also account for a substantial proportion of the total cost of optometrist visits for people with visual impairments. Private health insurance is the second largest payer of glasses and contact lenses and optometrist visits.
Visual impairments are associated with aging
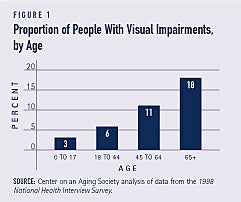
Visual impairments affect people of all ages. They are more common, however, among older age groups (see Figure 1). The proportion of people age 65 and older with visual impairments — 18 percent — is three times greater than the proportion of people under age 65 — 6 percent. The number of older people with visual impairments is likely to increase substantially over the next 30 years as baby-boomers age.
Who has visual impairments?
Gender, education and income are associated with the likelihood that people will have difficulty seeing. Differences in visual impairments between racial groups are more pronounced among older persons.
- Some 9 percent of women have visual impairments, compared to 6 percent of men.
- Adults with less than a high school education are almost twice as likely to have difficulty seeing as those who have a high school education or more — 14 and 8 percent, respectively.
- Among people with an annual income under $20,000, 15 percent have visual impairments. Only 6 percent of people with an annual income of $55,000 or more have trouble seeing, however.
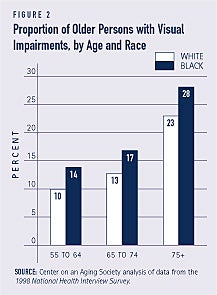
- Some 8 percent of blacks and 7 percent of whites have visual impairments. Differences are somewhat greater among older persons, however (see Figure 2).
Less than half of adults with visual impairments are employed
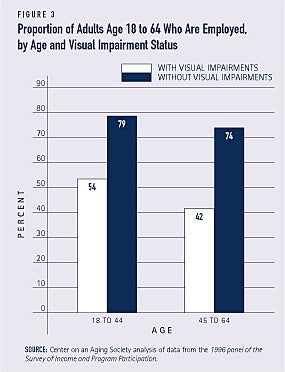
Among the population age 18 to 64, less than half — 46 percent — of those who have difficulty seeing are employed, compared to over three-quarters — 77 percent — of those who do not have difficulty seeing. The difference in employment status between those with and without visual impairments is larger among older adults (see Figure 3).
Adults who have visual impairments are more limited in their work
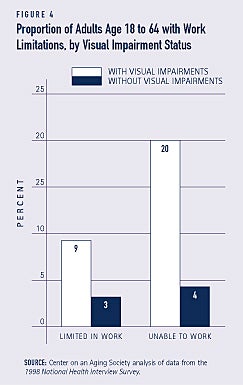
Adults with visual impairments may face limitations in the type or amount of work they can do, or they may be unable to work at all. For example, among the population age 18 to 64, the proportion of those who are unable to work due to a health condition is five times higher for those who have difficulty seeing, compared to those who do not (see Figure 4).
Adults with visual impairments earn less
Workers who have difficulty seeing earn less than those who do not. Among workers age 18 to 64, median annual earnings for those with visual impairments are $19,656, compared to $24,000 for those without impairments. The difference in earnings is even greater among older workers. Among workers age 45 to 64, median annual earnings for those who have trouble seeing are $20,043, compared to almost $28,800 for those who do not.
Social losses may accompany visual impairment
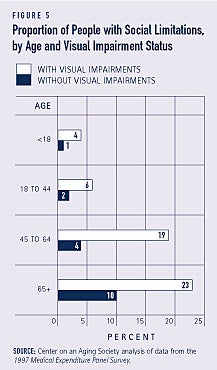
Regardless of age, visual impairments may hinder involvement in social activities as well as relationships with family and friends. A much larger proportion of people with visual impairments — 16 percent — are limited in social activities, compared to people without — 3 percent. The proportions of people who are limited in social activities increases with age (see Figure 5). Also, a larger proportion of adults who have difficulty seeing report trouble getting along with others, compared to adults who do not.
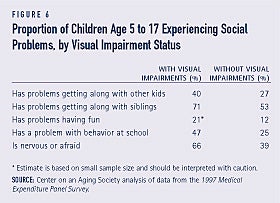
Children with visual impairments may also experience problems in social settings. For example, among children age 5 to 17, larger proportions of those who have difficulty seeing have problems getting along with their peers and having fun, compared to those who do not have difficulty (see Figure 6).
Depression is associated with visual impairments
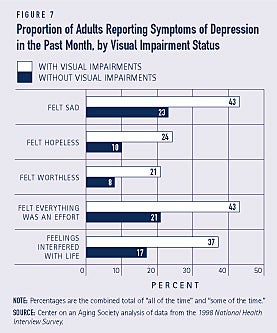
Larger proportions of adults with visual impairments report symptoms of depression, compared to adults without. Almost one-quarter of adults who have difficulty seeing, compared to only one-tenth of those who do not, report feeling hopeless all or some of the time in the past month (see Figure 7).
Low-income adults with visual impairments are less healthy
A much larger proportion of people with visual impairments — 30 percent — report their physical health as fair to poor, compared to those without impairments — 8 percent. Among the adult population with visual impairments, there are large differences in physical health status between those with low and high incomes. Half of adults with an annual family income under $20,000 report their health as fair to poor, compared to only 12 percent of adults with an annual family income of $55,000 or more.
Health care use is higher among those with visual impairments
Compared to people without visual impairments, larger proportions of people with visual impairments use health care services. Some 17 percent of those who have difficulty seeing had at least one overnight stay in the hospital in 1997, compared to only 6 percent of those who do not have difficulty (see Figure 8).
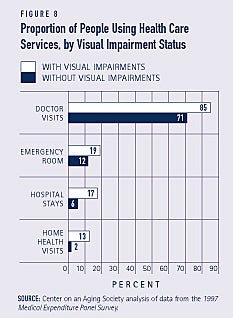
People who have trouble seeing also use health care services more frequently than those who do not have trouble. The median number of visits to the doctor in 1997, for example, by those with visual impairments is more than two times that of those without — 7 and 3, respectively.
Higher health care costs are associated with visual impairments
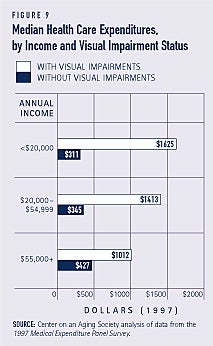
In 1997, the median value of total health care expenditures for those with visual impairments was almost four times that of those without. Differences between those with and without visual impairments are even greater at lower income levels. Among people who have an annual family income under $20,000, the median value of total health care expenditures for those who have difficulty seeing is five times that of those who do not (see Figure 9). This may reflect the finding that among people with visual impairments, those with lower incomes are less healthy than those with higher incomes.
Computer use is lower among adults with visual impairments
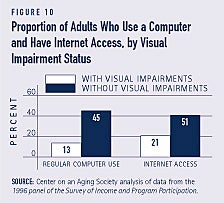
Advances in technology continue to enhance the lives of people who have difficulty seeing and may feel physically and socially isolated at times. Computer use and Internet access may also enhance quality of life for people with visual impairments. Computers and the Internet allow easier access to information, social interaction, and employment opportunities. Compared to adults who do not have difficulty seeing, smaller proportions of those who have difficulty regularly use computers and have access to the Internet at home or at work (see Figure 10).
1. Alliance for Aging Research (1999). Independence for Older Americans: An Investment for Our Nation’s Future. Washington, D.C.
2. National Eye Institute (2001). Vision Research–A National Plan: 1999?2003. National Institutes of Health: Bethesda, MD. Medical costs include outpatient care, inpatient care, pharmacy, nursing home care, rehabilitation services, health care equipment, and personal expenses.
3. Prevent Blindness in America (2002). Vision Problems in the U.S
4. Faye, E. and W. Stappenbeck (2000). Changes in the Aging Eye. Lighthouse International: New York, NY.
ABOUT THE DATA
Unless otherwise noted, the data presented in this Profile are from three national surveys of the United States civilian non-institutionalized population. The National Health Interview Survey (NHIS), which is conducted annually by the National Center for Health Statistics (NCHS), is the principal source of information on the health of the U.S. population. The 1998 NHIS asks respondents in the Sample Adult and the Sample Child data files if they have “trouble seeing even with glasses or contact lenses.” The Medical Expenditure Panel Survey (MEPS) is cosponsored by the Agency for Healthcare Research and Quality and the NCHS. It provides national estimates of health care use, expenditures, sources of payment, and insurance coverage. The 1997 MEPS asks respondents if they have “difficulty seeing even with glasses or contact lenses.” The Survey of Income and Program Participation (SIPP) is a panel study conducted by the U.S. Census Bureau. The 1996 panel of SIPP includes a topical module on Adult Disability, which asks people age 15 and older if they have “difficulty seeing the words and letters in ordinary newspaper print even when wearing glasses or contact lenses.”.
ABOUT THE PROFILES
This is the second set of Data Profiles in the series, Challenges for the 21st Century: Chronic and Disabling Conditions. The series is supported by a grant from the Robert Wood Johnson Foundation. This Profile was written by Craig Salman and Lee Shirey. It is the third in the series. Previous Profiles include:
1. Screening for Chronic Conditions: Underused services
2. Childhood Obesity: A lifelong threat to health
The Center on an Aging Society is a Washington-based nonpartisan policy group located at Georgetown University’s Institute for Health Care Research and Policy. The Center studies the impact of demographic changes on public and private institutions and on the economic and health security of families and people of all ages.


